 What is digital media? Digital media is any online media. It consists of five elements: web design, graphic design, audio, animation, and video. The five elements are used for different purposes. The four purposes are: commercial, entertainment, education, and informational. Commercial digital media would be advertisements and commercials. An example of this element is Chick-fil-a’s “eat mor chikin” billboard. The billboard is used for commercial purposes to persuade people to eat more chiken. Educational and informational digital media could be an infographic, blog post, or a how-to video. Animation and video are just two examples of how you could use digital media to entertain people. Before creating a piece of digital media, you should go through the three stages of production. 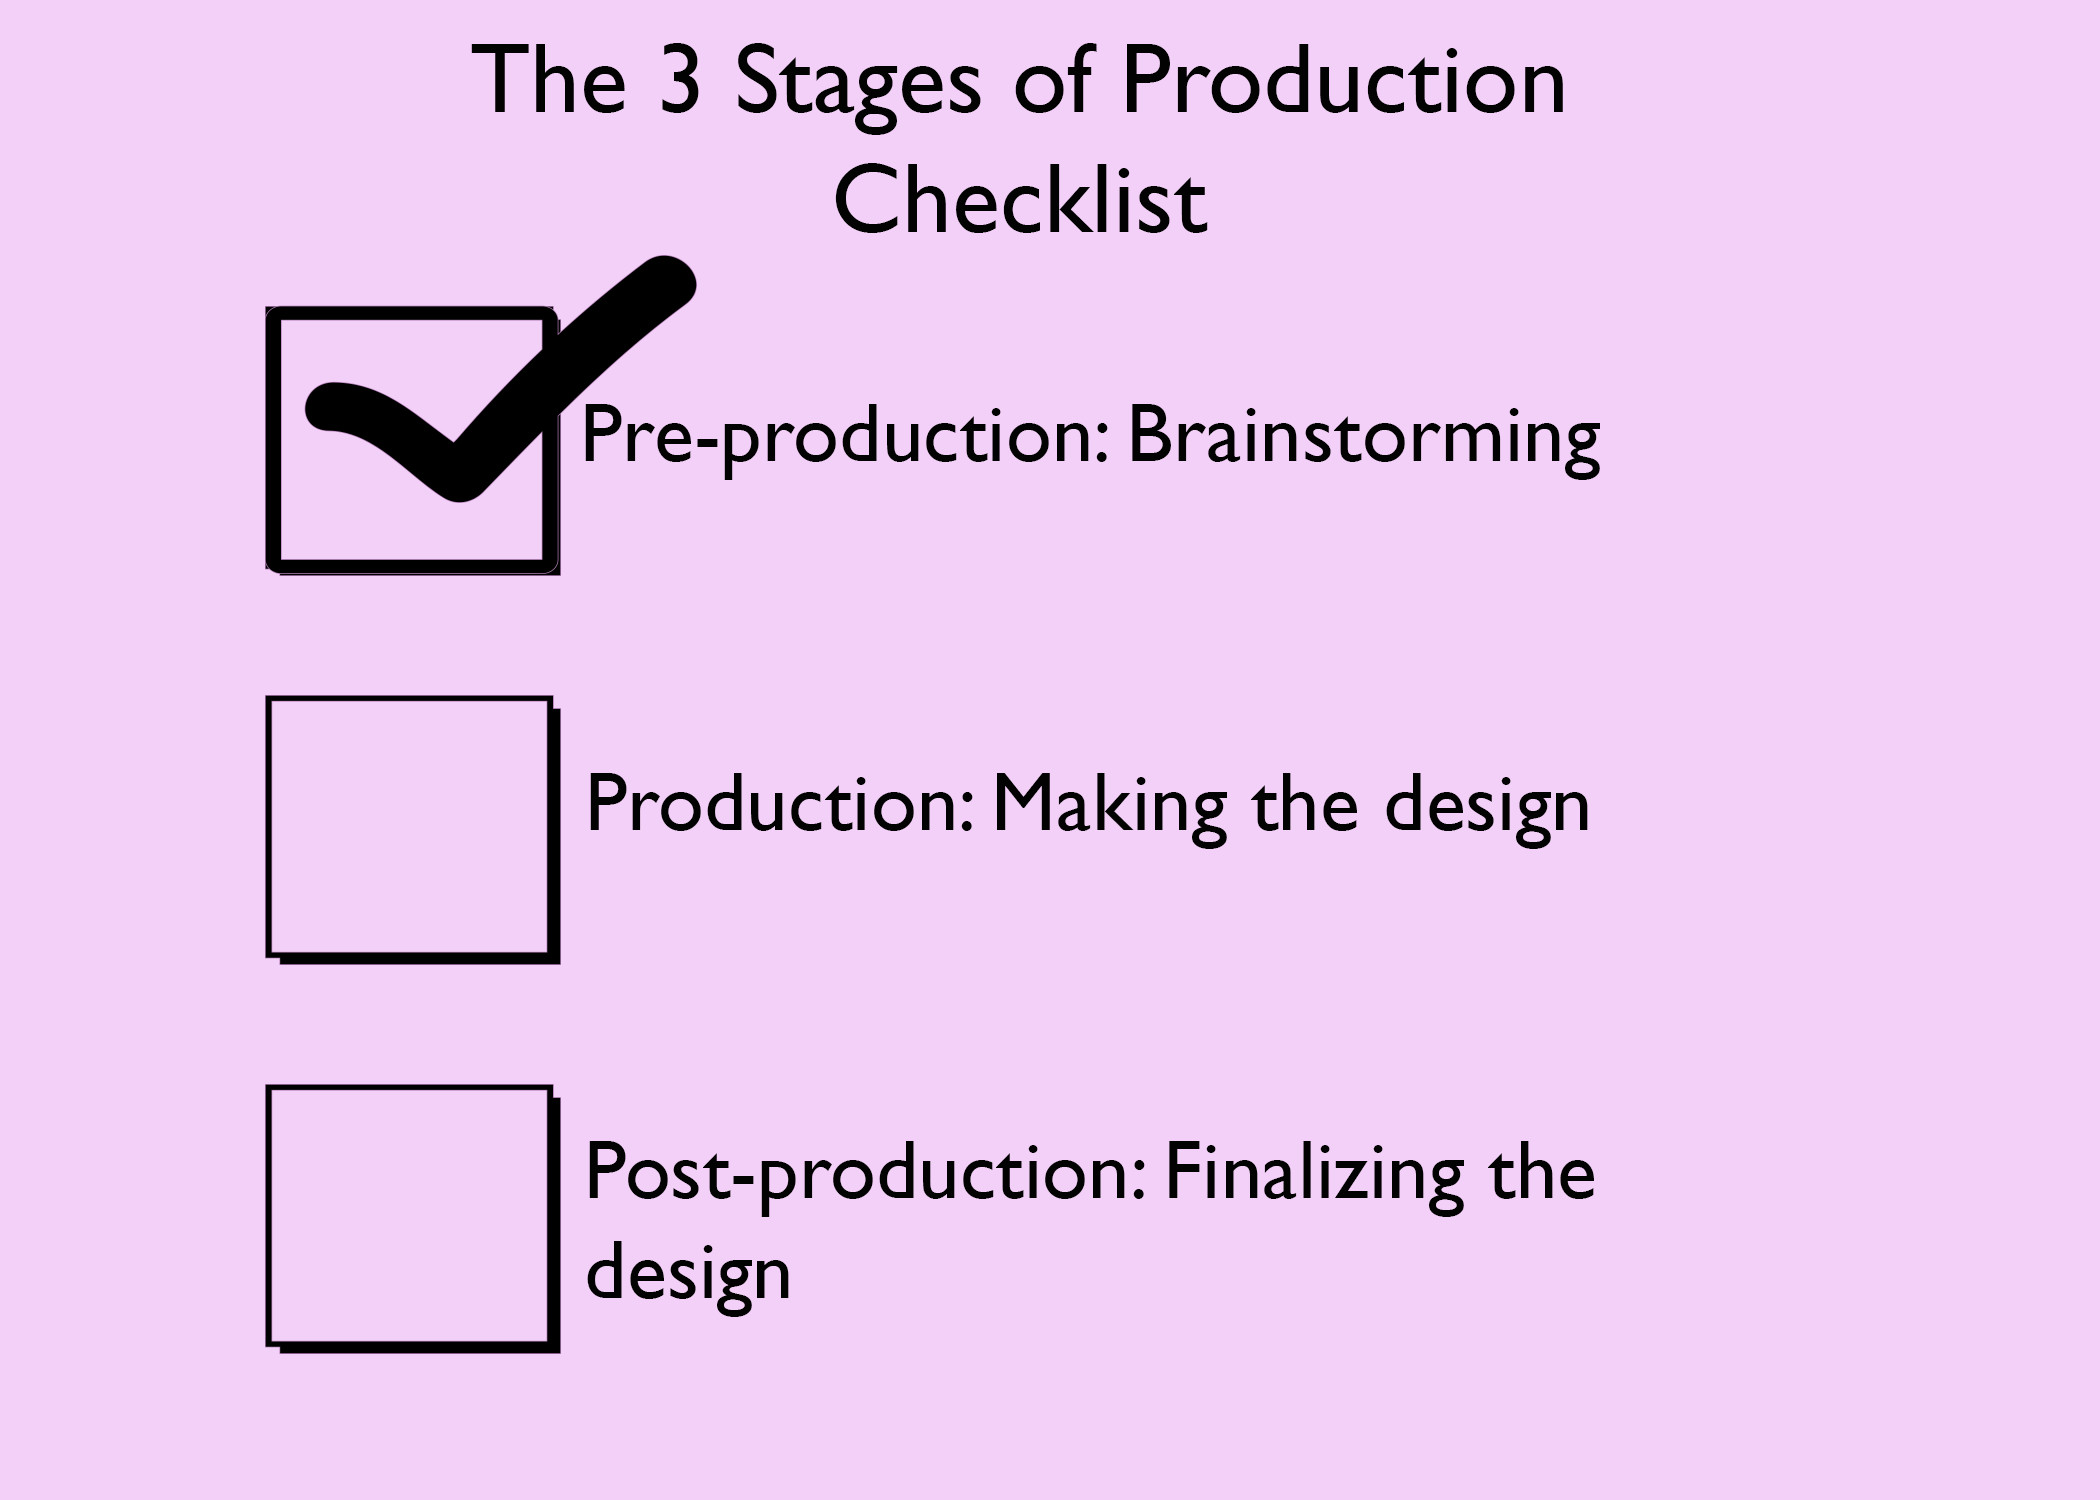 Do you know the three stages of production? They are pre-production, production, and post-production. Pre-production consists of the steps before actually making your product. It is as simple as brainstorming, researching, and sketching your ideas or concepts. After you have passed through the pre-production stage and have an concept, you enter the production stage. The production stage is simple and might take the longest. This is where you actually make your idea. Once you have made the concept or idea, you enter the post-production stage. That is where you fine tune your concept into something better and then publish it. For a graphic design, you would get someone to give you feedback on the design. Then, you would take their feedback and edit your design. Once, you have edited the design and you think that it is ready for the world to see, you would publish it to your portfolio. Above this paragraph is a checklist that I made to show the three stages.
8 Comments
I had some trouble with the sensor because I had an apple phone, but I got the idea. The one that I want thought was interesting was the ambient temperature sensor. The sensor detects the temperature of an object. It collects quantitative data. I might be able to use the ambient temperature sensor to find out the different temperatures of the buildings on campus. I would use a spreadsheet, so the information is easier to understand and make charts. A bar/column chart or pie chart to show the different temperatures in the different buildings. For example, for a pie chart, I might have percents of temperatures over 70 and the buildings. The bar/column chart could be the buildings and the temperatures. The info graphic below should help you understand sensors better. 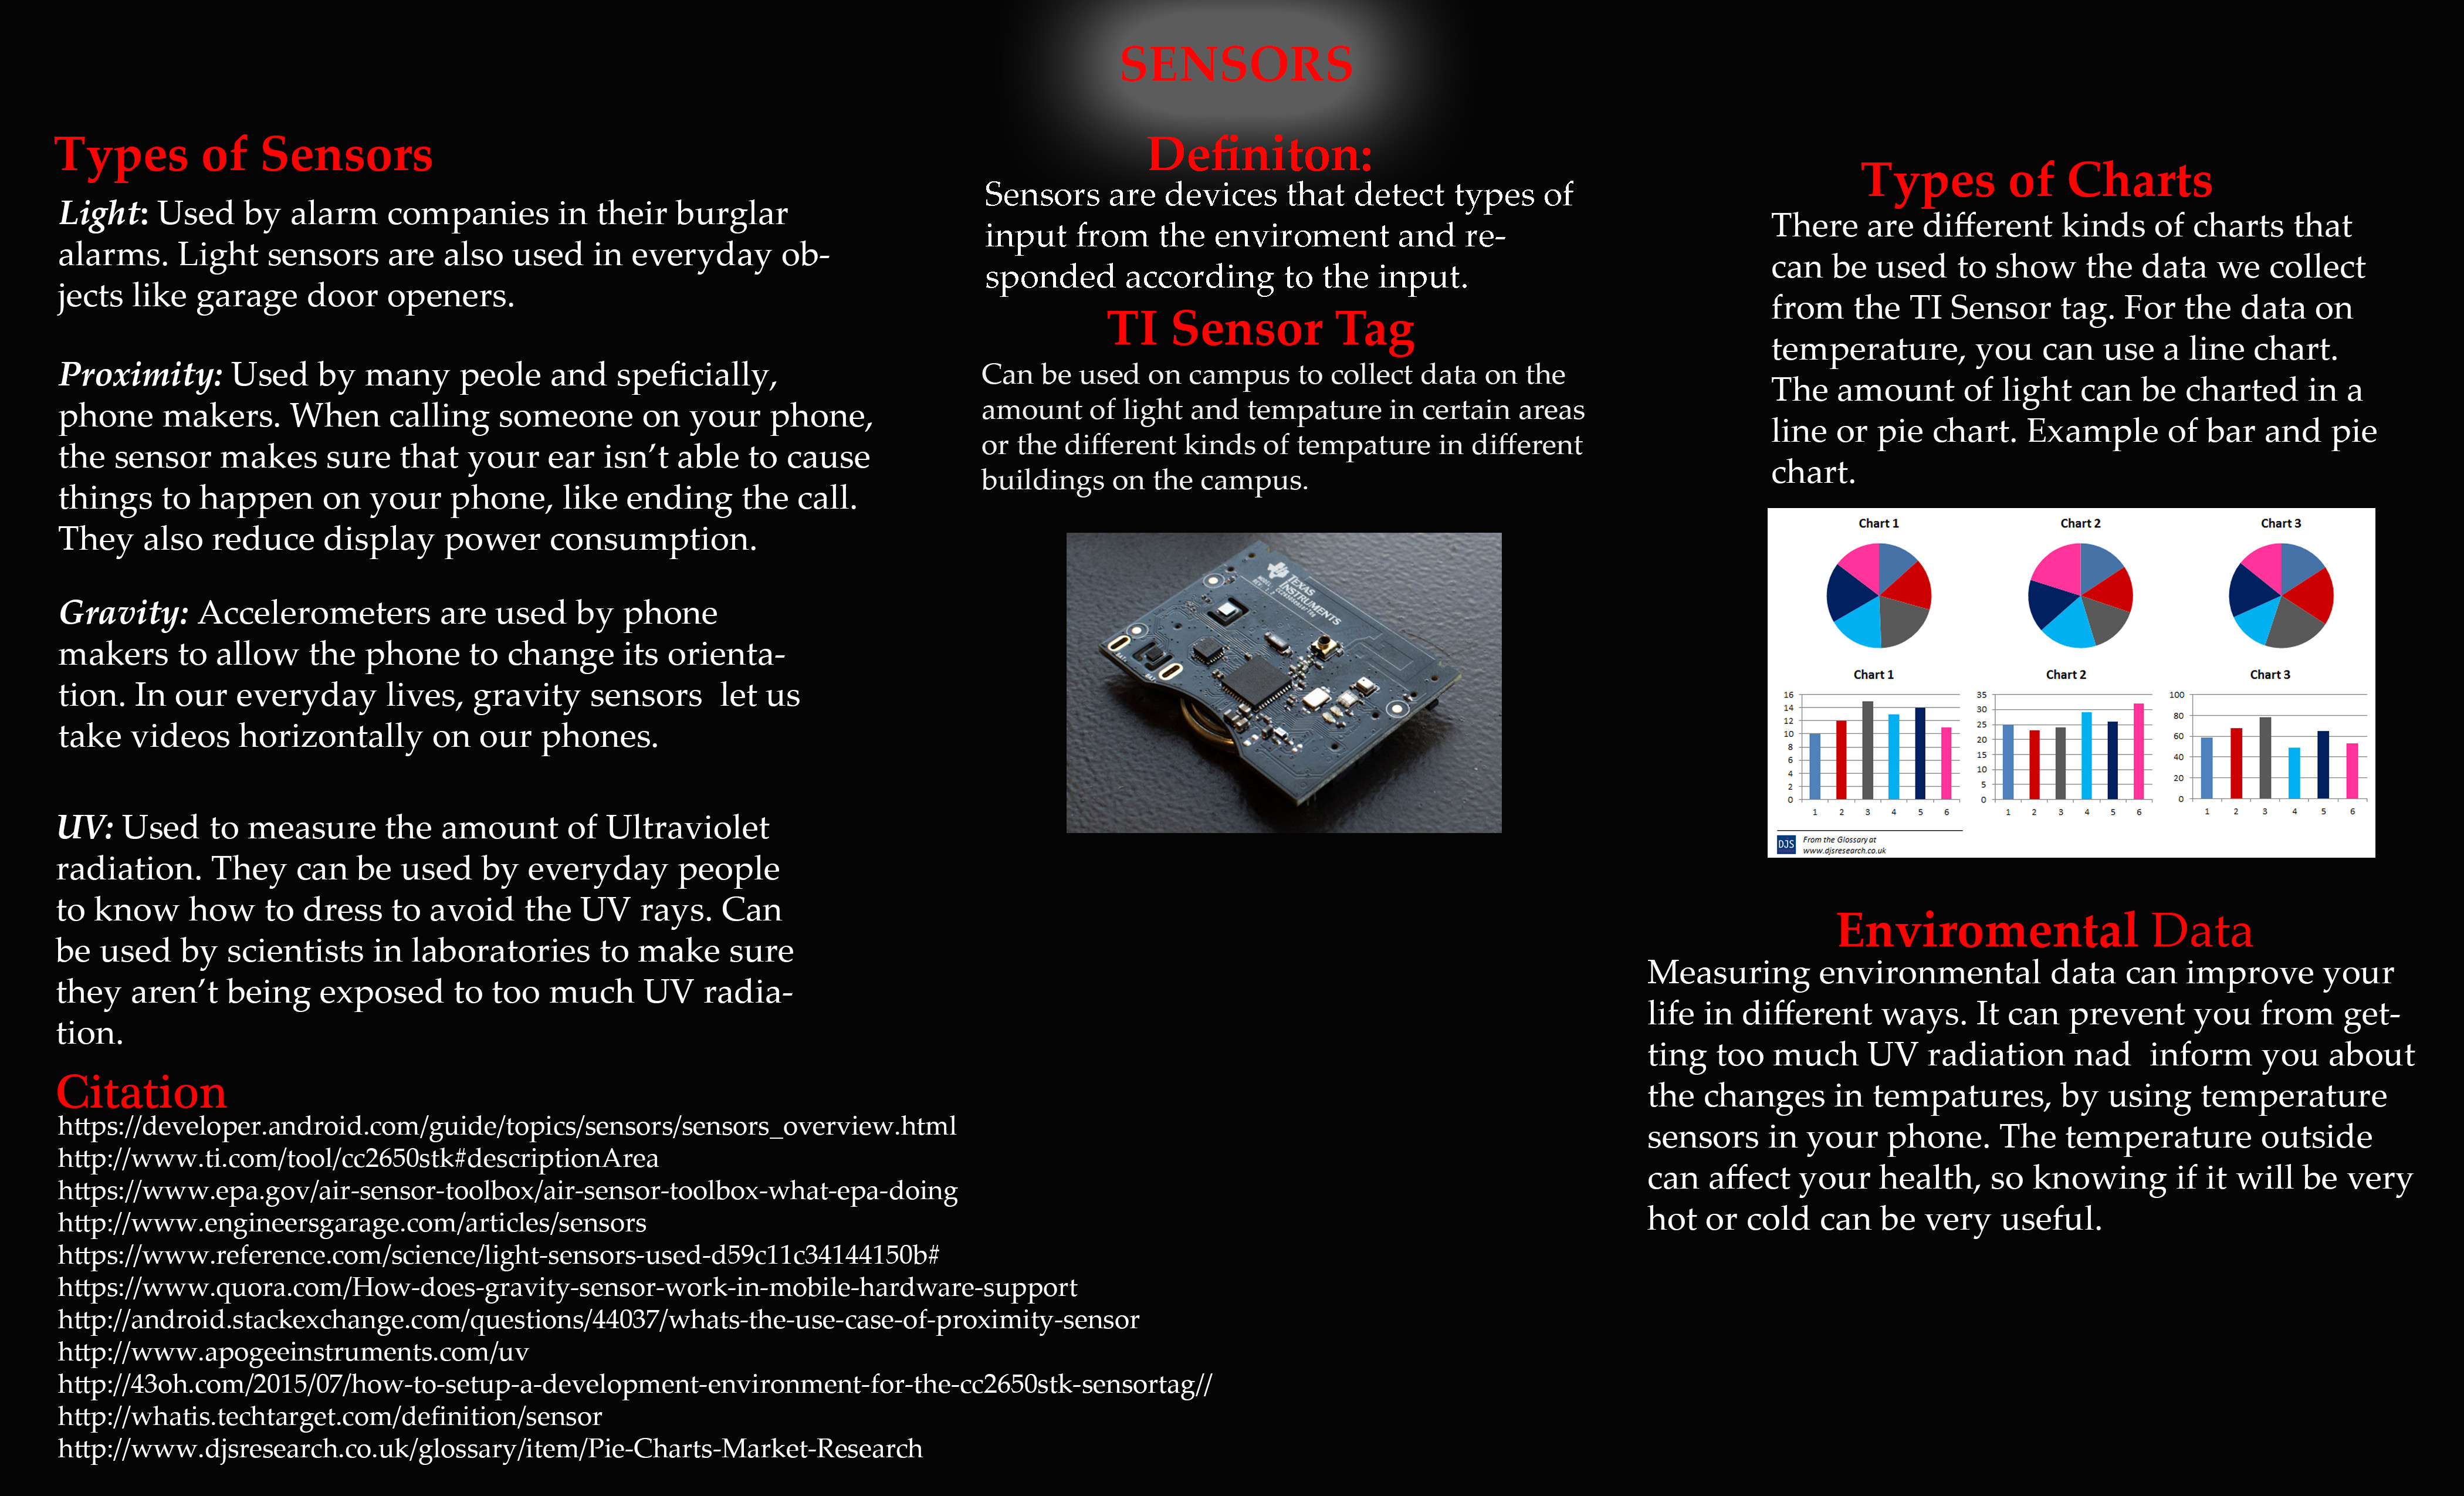 Data visualization is important to me, because it makes things easier for me to understand. I am one of those students who is partly a visual learner. If you just give me a lecture, I won't know what is going on and probably zone out. However if you give me an info graphic or a presentation with pictures, I will understand it better. I am draw to eye-catching things, so when we are doing lectures with sketch-notes in class, I understand the information.
I think that the level of awareness of world problems in students at school and around the country should be changed, by using data visualization techniques. I would make info-graphics and charts to teach student's about global issues, like climate change or poverty. Some people in our school seem very oblivious to the third world problems. Just adding charts and graphs around the school might help inform people. Something as simple as putting them on the back of bathroom doors would be step in changing the level of awareness in students at our school and around the country. |
